How to Add a Trendline in Excel
In this tutorial, we’re going to cover how to add a trendline in Excel. This element is invaluable when you need to make a clear and neat visual representation of the data trend.
Let’s start!
See the video tutorial and transcription below:
See this video on YouTube:
https://www.youtube.com/watch?v=L9wW3vdRkg4
To use the trendline function in Excel, you’ll need to organize data into a chart first. For more information on how to make a bar chart or for some useful advice on making graphs, watch more video tutorials by our team. You can find the links in the description below.
Now, we’re gonna go through how you can add a trend line into a chart. This tutorial also shows how you can format the trend line or how to remove it from the chart completely in case you don’t need it anymore.
We’ll go through each step now, starting with the first one.
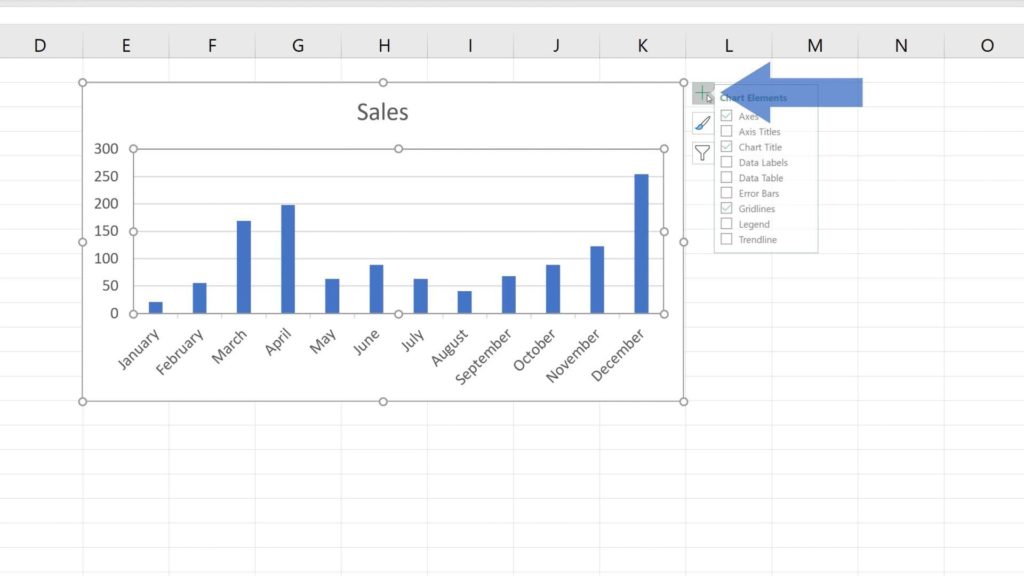
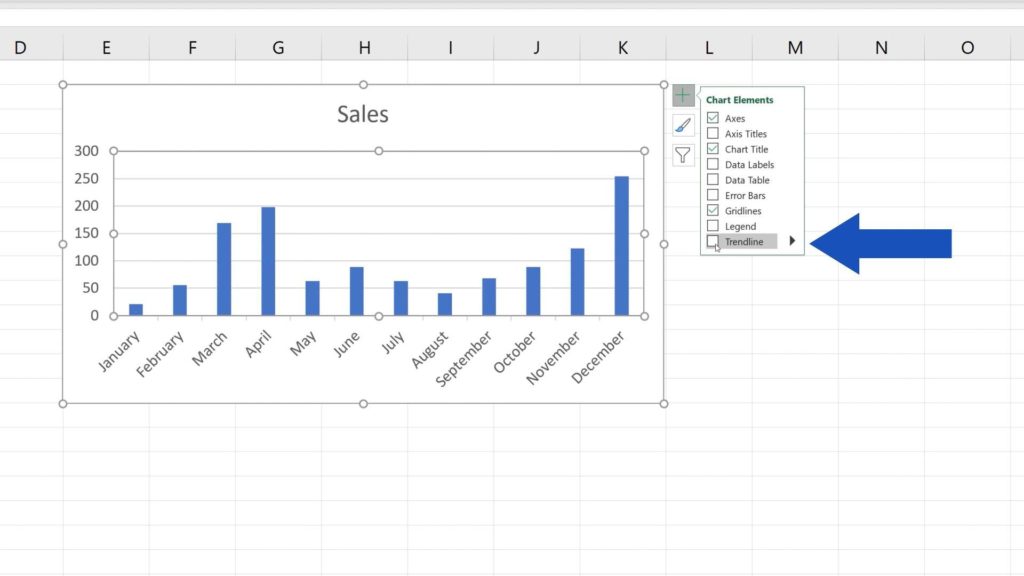
To add a trend line to this bar chart, click on the graph. Then click on this green plus sign icon located on the right-hand side, which opens a list of options. Here you can select or deselect various chart elements.
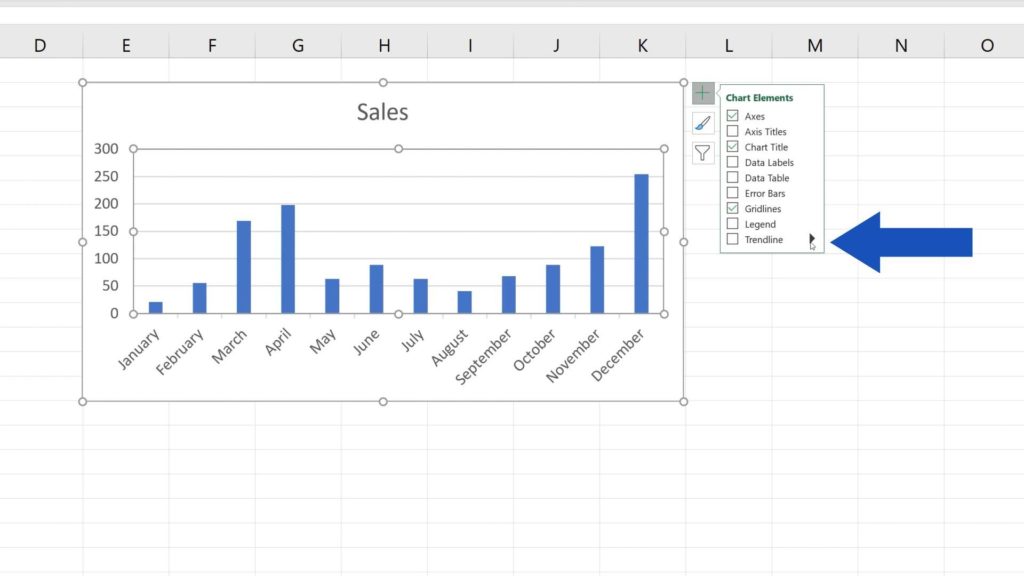
We want to display a trend line, so hover over ‘Trendline’ and click on the arrow that appears next to the text.
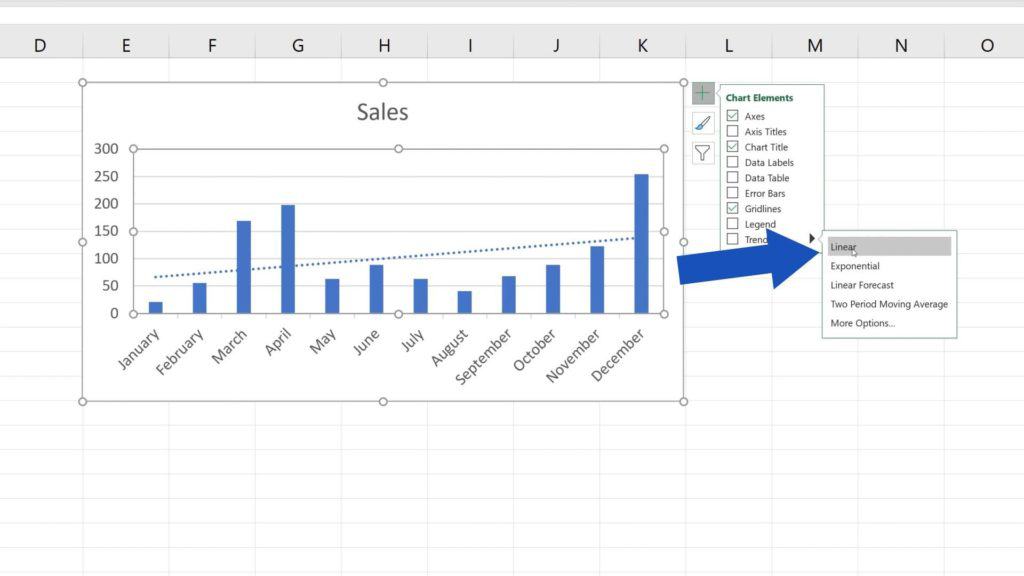
Choose the trend line type you need, for example, linear, exponential, or any other type. In this case, we’ll go for the first one, so click on ‘Linear’.
Once it’s been selected, we can have a look at how we could format the trend line and change it depending on what we need.
How to Edit (Format) a Trendline in Excel
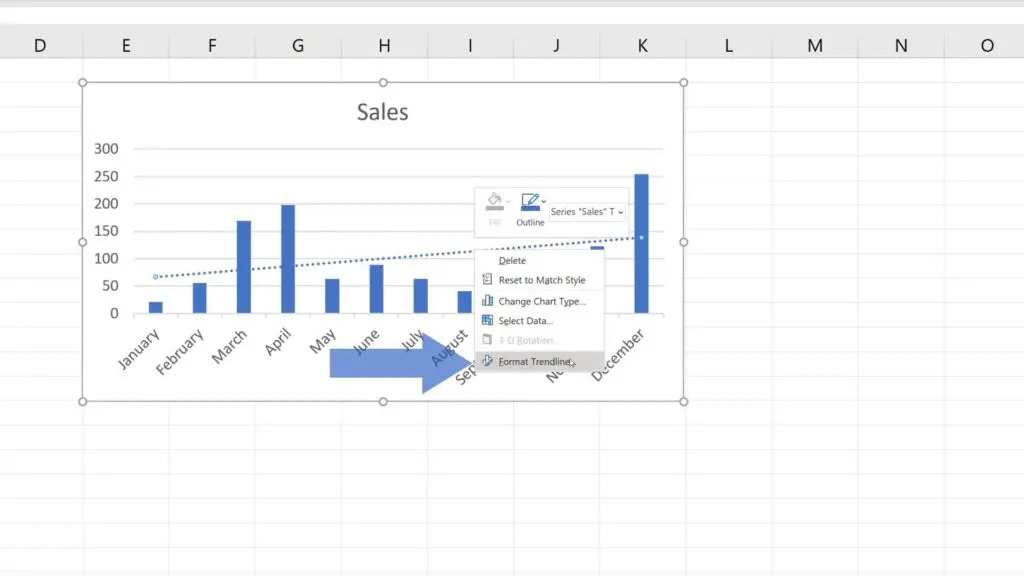
If you want to format the trend line, click on the line with the right mouse button.
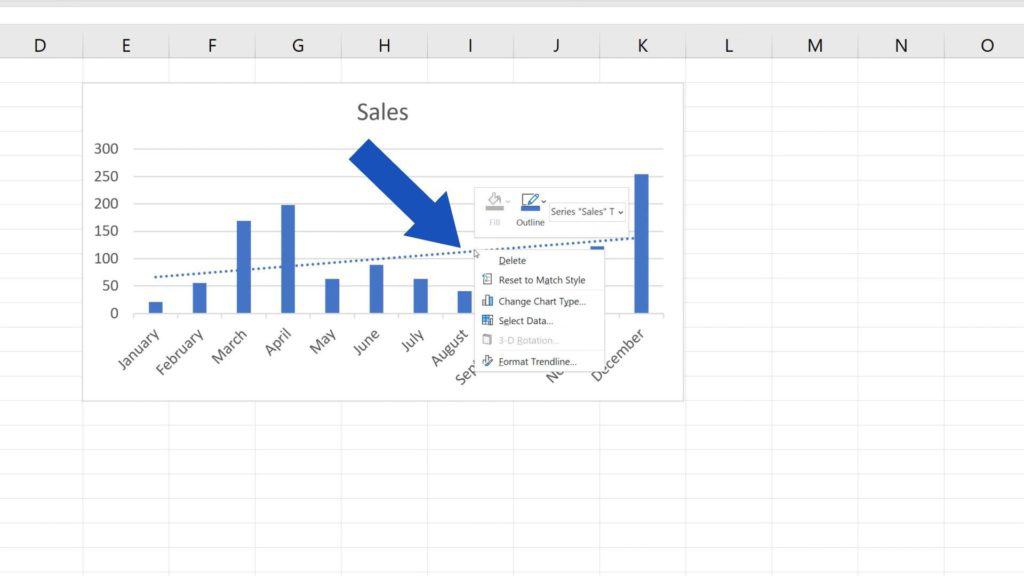
Select ‘Format Trendline’.
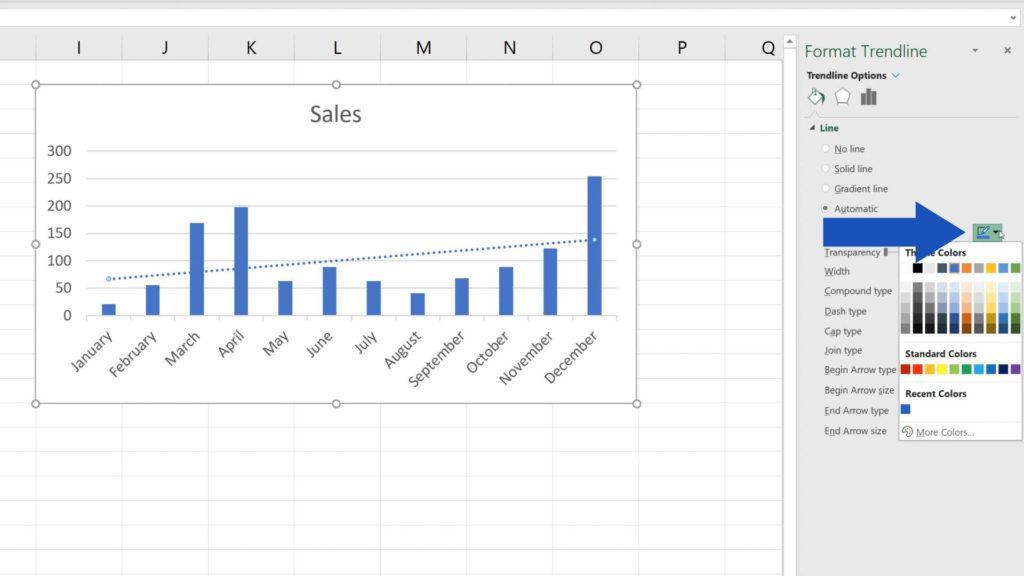
On the right-hand side, you’ll see a task pane with more options. Here we can take a moment to go through the basic ones.
In the section ‘Trendline Options’, you can change the type of the trend line.

If you need to change the colour of the line, you can go to the section ‘Fill & Line’.

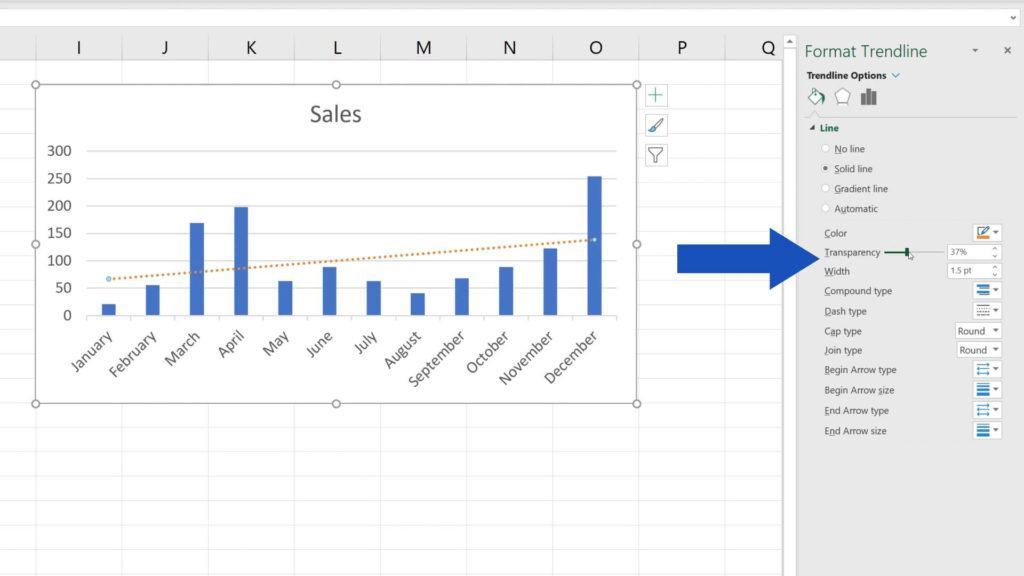
Here you can set the desired colour,
along with ‘Transparency’, the width or other parameters.
How to Remove a Trendline in Excel
Let’s close the task pane now and let’s have a look at the last point of the tutorial – how to remove the trend line from the chart completely.
Simply, click on the chart, then the green plus sign icon, and the options which you’re already familiar with appear. Simply unselect ‘Trendline’.
And that’s it! The trend line has been removed from the chart.
If you found this tutorial helpful, give us a like and watch other video tutorials by EasyClick Academy. Learn how to use Excel in a quick and easy way!
- Try out Data Bars in Excel for clear graphical data representation
- How to Visualize Data in Excel
- How to Make a Pie Chart in Excel
- How to Make a Bar Graph in Excel
- How to Make a Line Graph in Excel
Is this your first time on EasyClick? We’ll be more than happy to welcome you in our online community. Hit that Subscribe button and join the EasyClickers! You may also find Excel Analyst Jobs with Jooble.
Thanks for watching and I’ll see you in the next tutorial!

 How to Subtract a Percentage in Excel
Welcome! Today we’re going to talk about the simplest way how to…